Cloud Migration Strategy Matrix
The biggest problem with most cloud migration assessments is that it focuses on VM-sizes and potential cost savings. Don’t get me wrong, this is a very important area of concern… and there are some immediate benefits to simple cloud migration… but why transition to a life in paradise only to maintain a similar lifestyle? Transitioning to the cloud should be about harnessing its full potential — embracing qualities like agility, elasticity, reliability, security, etc. It’s about making the most of the cloud’s transformative capabilities rather than just replicating existing setups.
 Cloud Adoption Benefits Pyramid
Modernizing every workload is not a practical approach. To determine which workloads to modernize to cloud-native, migrate to IaaS, or refactor to serverless, a decision strategy is necessary. In this post, I will discuss the decision strategy that I use.
If you haven’t done a cloud migration assessment yet, this is a good place to start. I recommend using specialized tools to scan your digital estate as they discover workloads that you forgot or did not know existed. Migration tools generate a comprehensive list of servers with their corresponding CPU utilization. This provides insights into whether those servers are still in use, oversized, or candidates for decommission.
Cloud Migration Report Analysis
Step 1: Group Servers by Workload | Workload Inventory
The first step is to group your server list into a set of workloads. For example, a group of web, app, and DB servers may all be related to an intranet employee site. This gives you a clearer picture of what is represented by those servers.
| # | Server Name | Workload Name | CPU | RAM | Disk Size | CPU Utilization % |
|---|---|---|---|---|---|---|
| 1 | mssqlsvr01 | Employee Intranet | 4 cores | 16 GB | 500 GB | 70% |
| 2 | appsvr01 | Employee Intranet | 4 cores | 16 GB | 250 GB | 45% |
| 3 | web01 | Employee Intranet | 2 cores | 8 GB | 250 GB | 85% |
| 4 | mssqlsvr02 | CRM | 8 cores | 32 GB | 1 TB | 70% |
| 5 | appsvr02 | CRM | 8 cores | 16 GB | 500 GB | 45% |
| 6 | web02 | CRM | 4 cores | 8 GB | 250 GB | 85% |
| 7 | mssqlsvr03 | Retail eCommerce | 8 cores | 32 GB | 1 TB | 30% |
| 8 | web03 | Retail eCommerce | 8 cores | 32 GB | 500 GB | 50% |
| 9 | mssqlsvr03 | Retail eCommerce | 4 cores | 8 GB | 500 GB | 20% |
| 10 | filesvr01 | File Sharing | 4 cores | 8 GB | 2 TB | 20% |
| 11 | mailsvr01 | Email Services | 8 cores | 32 GB | 1 TB | 75% |
| 12 | cache01 | Caching Server | 2 cores | 4 GB | 250 GB | 90% |
| 13 | backup01 | Backup Services | 8 cores | 32 GB | 10 TB | 55% |
This table is oversimplified for illustration purposes. In reality, this is a tedious and manual process, but it is worth the time. Assessment tools will only be able to tell if a server is a web or DB server, but they won’t know if it’s an e-commerce site, a CRM, or something else. Someone will just have to do the work.
There are two common challenges I’ve encountered when creating this view:
- Servers may be shared and may contain multiple workloads: In this case, indicate the multiple workloads contained in those servers. Cloud sizing is elastic, so it is not a problem to split up the workloads into different cloud services with smaller sizes.
- It’s not easy to determine which workloads are running on each server: This will have to be resolved manually. It involves checking the dependency mapping (which is part of the cloud migration report) and inspecting each unknown server to discover what workload it is for.
Step 2: Create a Business Differentiation/Code Complexity Scatter Plot
Now that you have a workload inventory list, the next step is to understand the Business Differentiation and Code Complexity of each workload.
On a scale of 1 to 10, rate the business differentiation of each workload.
- Is the workload revenue generating? How does it affect your bottom line?
- Does it require frequent changes due to market changes, competition, or agile business priorities?
- Is it a workload that you think will greatly benefit from the promises of the cloud?
On a scale of 1 to 10, rate the code complexity of each workload.
- How easy is it to make changes to the code?
- Do you still have developers who know the code?
- If you make code changes, can you still do the regression tests required?
- If you want to rebuild it, do you still have (or need) up-to-date functional documentation?
- It is a bought solution and you do not own the code? Think of this as deployment complexity instead. How easy is it to redeploy this workload to the cloud?
- Are there organizational, political hurdles or other non-technical factors that prevent you from making changes to the code or redeploying the workload to the cloud?
Using our example, we can rate the workloads as follows:
| Workload Name | Business Differentiation | Code Complexity |
|---|---|---|
| Employee Intranet | 2 | 4 |
| CRM | 3 | 9 |
| Retail eCommerce | 10 | 7 |
| File Sharing | 1 | 1 |
| Email Services | 2 | 2 |
| Caching Server | 3 | 1 |
| Backup Services | 4 | 4 |
Continue doing this for all of your workloads and then create a scatter plot. The resulting graph will look something like this:  Workload Scatter Plot by Business Differentiation and Code Complexity
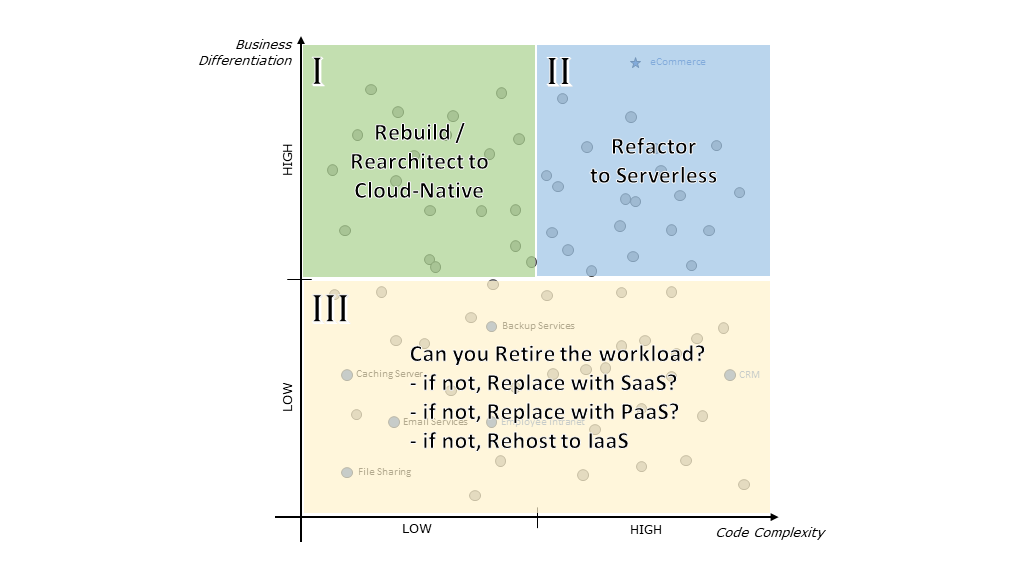
The Cloud Migration Strategy Matrix
With this scatter plot, we can now group the workloads into three areas. Each area represents a different migration strategy.
 Cloud Migration Strategy Matrix
- Area I is about rearchitecting the workload to cloud-native. This almost-always involves a complete rewrite of the application and is only recommended for workloads with high business impact. As this takes time, most organizations will Rehost to IaaS or Refactor to Serverless first as they work on the cloud-native version in parallel.
- Area II is about deploying the workload components to serverless. The cloud offers many services that require minimal-to-no code changes to migrate, such as PaaS web apps and databases. These services allow you to get many cloud benefits with minimal effort.
- Area III is where you can do anything you want. It comprises of workloads that are low in business impact with varying code complexity. These are the workloads that you should do the least effort to migrate and to maintain (post-migration). Rehosting to IaaS will involve the least migration effort, but replacing with an equivalent cloud service will help you simplify your infrastructure and optimize your operations. These low differentiating workloads are also the top candidates to retire and exclude from the cloud migration effort.
It is important to emphasize that business differentiation does NOT mean business criticality. Having a reliable CRM is business critical but not business differentiating. Almost every successful business will have a good CRM system. The same is true for SAP. Is SAP business critical? Absolutely! But does it differentiate you vs. your competitors? No, they likely use SAP as well… and you don’t care if they are using a later version than you. Examples like CRM and SAP are great candidate workloads to migrate to solutions like D365 CRM or SAP RISE. Migrating to a SaaS or a cloud-managed service will allow you to focus operations to your business differentiating workloads.
Concluding our example, the resulting cloud migration strategy for our server inventory will result to this:
| # | Server Name | Workload Name | CPU | RAM | Disk Size | CPU Utilization % | Business Differentiation | Code Complexity | Area | Migration Strategy | Notes |
|---|---|---|---|---|---|---|---|---|---|---|---|
| 1 | mssqlsvr01 | Employee Intranet | 4 cores | 16 GB | 500 GB | 70% | 2 | 4 | III | Rehost to IaaS | |
| 2 | appsvr01 | Employee Intranet | 4 cores | 16 GB | 250 GB | 45% | 2 | 4 | III | Rehost to IaaS | |
| 3 | web01 | Employee Intranet | 2 cores | 8 GB | 250 GB | 85% | 2 | 4 | III | Rehost to IaaS | |
| 4 | mssqlsvr02 | CRM | 8 cores | 32 GB | 1 TB | 70% | 3 | 9 | III | Replace with SaaS | |
| 5 | appsvr02 | CRM | 8 cores | 16 GB | 500 GB | 45% | 3 | 9 | III | Replace with SaaS | |
| 6 | web02 | CRM | 4 cores | 8 GB | 250 GB | 85% | 3 | 9 | III | Replace with SaaS | |
| 7 | mssqlsvr03 | Retail eCommerce | 8 cores | 32 GB | 1 TB | 30% | 10 | 7 | II | Refactor to Serverless | Rearchitect in Phase 2 |
| 8 | web03 | Retail eCommerce | 8 cores | 32 GB | 500 GB | 50% | 10 | 7 | II | Refactor to Serverless | Rearchitect in Phase 2 |
| 9 | mssqlsvr03 | Retail eCommerce | 4 cores | 8 GB | 500 GB | 20% | 10 | 7 | II | Refactor to Serverless | Rearchitect in Phase 2 |
| 10 | filesvr01 | File Sharing | 4 cores | 8 GB | 2 TB | 20% | 1 | 1 | III | Replace with PaaS | Azure Files |
| 11 | mailsvr01 | Email Services | 8 cores | 32 GB | 1 TB | 75% | 2 | 2 | III | Replace with SaaS | M365 |
| 12 | cache01 | Caching Server | 2 cores | 4 GB | 250 GB | 90% | 3 | 1 | III | Replace with PaaS | Azure Redis Cache |
| 13 | backup01 | Backup Services | 8 cores | 32 GB | 10 TB | 55% | 4 | 4 | III | Replace with PaaS | Azure Backup |